
Statistics and Probability Complete Unit Bundle | 4-Week Curriculum | Grade 8-12
Secure Razorpay checkout · Instant download · No refunds (digital product)
You'll be asked to sign in first
Quick overview
The **Statistics & Probability Complete Unit** is a comprehensive, ready-to-teach **4-week math unit for Grades 8–10** designed to build students’ statistical reasoning, probability skills, data literacy, and ability to interpret mathematics in meaningful contexts.
The unit combines **guided notes, practice, real-world data analysis, probability experiments, projects, and assessment** so students move from calculating statistics to explaining what the results actually mean. Topics include **measures of center and spread, data displays, outliers, probability, permutations and combinations, normal distribution, and introductory hypothesis testing**.
Ideal for **Middle School Math, Pre-Algebra, Algebra 1, Statistics & Probability, math centers, stations, review, intervention, and enrichment**, the resource emphasizes analyzing data, drawing conclusions, and applying probability and statistics to authentic situations. These goals align with established mathematics standards and statistical education recommendations that emphasize interpreting data, analyzing distributions, making inferences, and applying probability concepts.
Product description
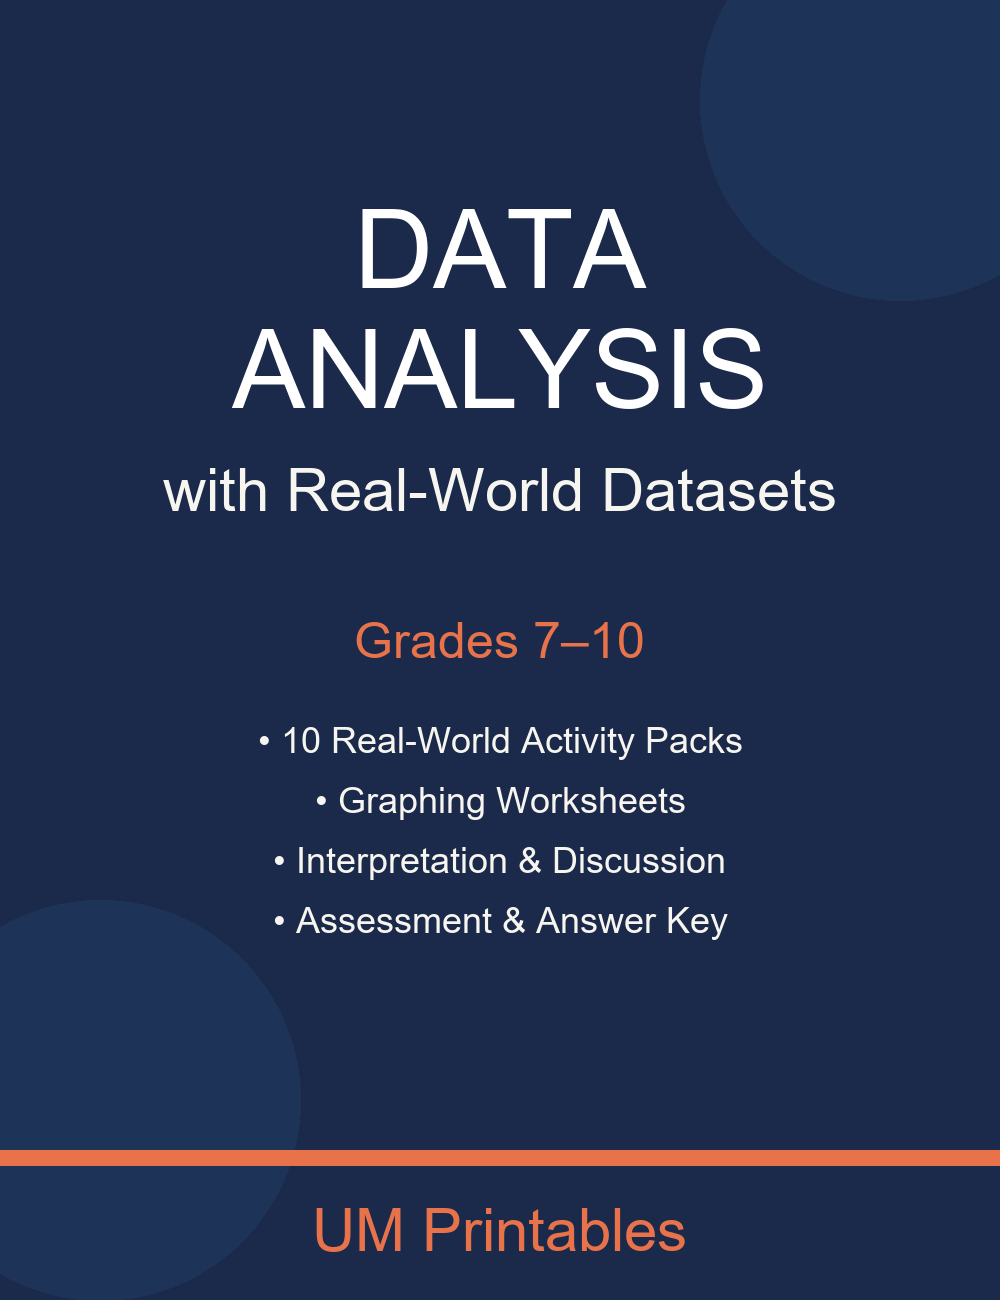
🔥 Stop piecing together fragmented stats lessons! This all-inclusive, 4-Week Statistics and Probability Complete Unit is designed to save you dozens of hours of planning while keeping your Grades 8–10 students engaged with rigorous, real-world math.
From calculating measures of center to making data-driven inferences in hypothesis testing, this premium TPT mega-resource has everything you need to deliver a flawless unit. No textbook required—just print, teach, and watch your students master data analysis!
🎓 WHAT’S INCLUDED IN THIS 4-WEEK BUNDLE?
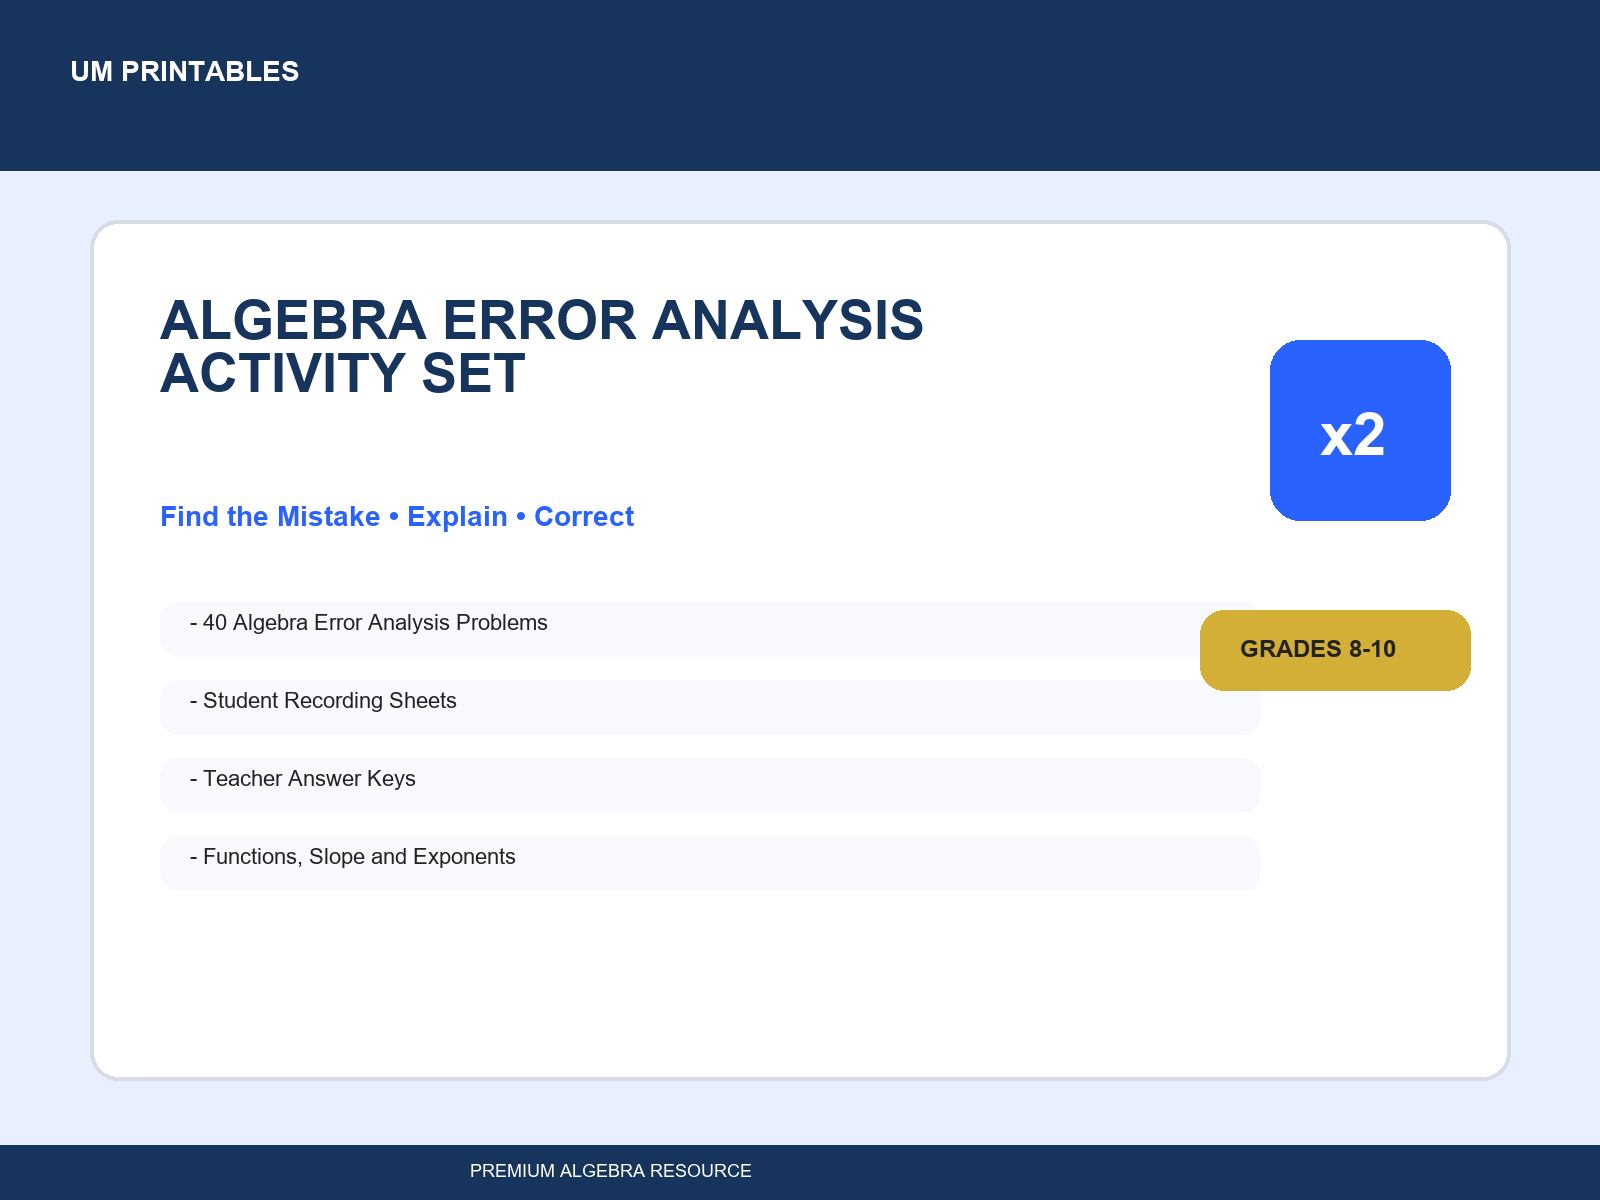
Comprehensive, print-and-go worksheets covering every standard in the unit. Includes space for student work and structured practice problems for measures of center, spread, probability, normal distribution, and more. 📊 Visual Guided Notes
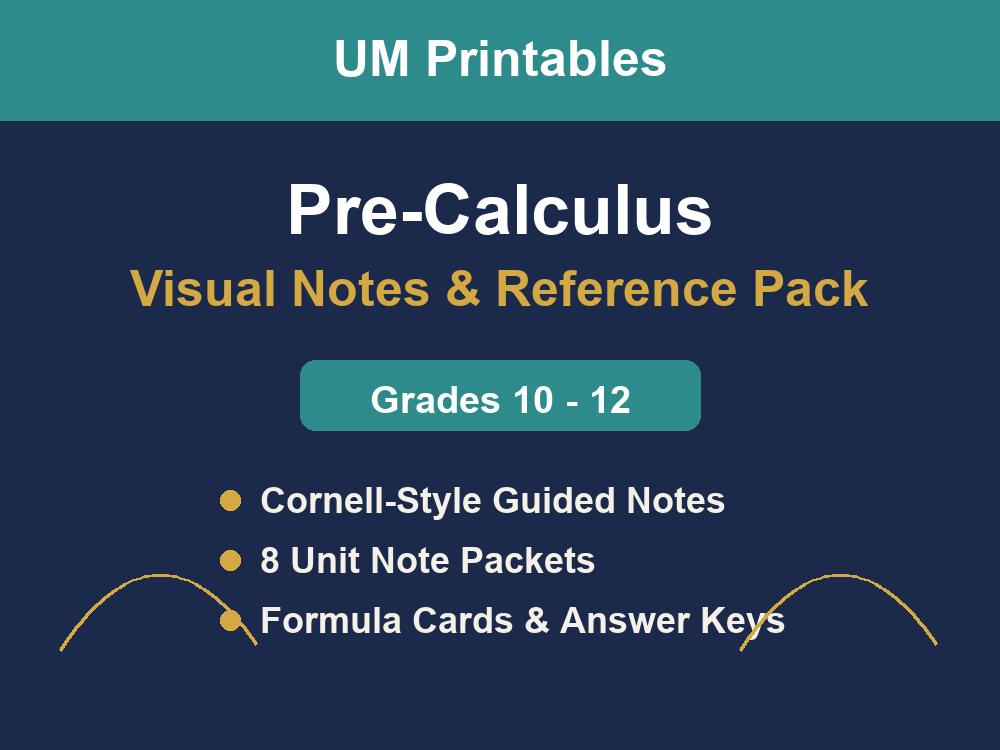
Professionally designed note templates for every major topic (Measures of Centre & Spread, Data Displays, Permutations vs. Combinations, Normal Distribution, and Hypothesis Testing). Helps visual learners organize information and creates a perfect study guide for the unit test. 🌍 8 Real-World Data Set Analysis Activities
Move beyond generic numbers! Students analyze authentic, high-interest data contexts: Tech Startup Salaries Climate Comparison: Coastal vs. Desert Standardized Test Scores: SAT Math The Fertilizer Claim: A Statistical Test Air Quality Index (AQI) & Outliers Track & Field: 100m Dash Times Quality Control: Manufacturing Defects Election Polling & Hypothesis Testing Builds critical thinking as students calculate statistics and interpret meaning in context. 🔬 4 Probability Experiment Lab Guides
Hands-on, interactive labs that bring probability to life: The Coin Flip: Theoretical vs. Experimental Probability The Dice Roll: Compound Probability & Sample Spaces The Bean Machine: Simulating the Normal Curve The Monty Hall Problem: Conditional Probability 🏗️ 3 Project Options with Grading Rubrics
Assess student understanding beyond multiple choice! Project 1: The Statistical Infographic Project 2: Probability Carnival Game Project 3: Data Journalism Report Detailed rubrics included for fast, fair grading. 📝 Comprehensive Unit Test + Answer Keys
A meticulously crafted summative assessment covering all unit standards. Includes a detailed answer key with 100% accurate solutions for every question in the entire unit! 📚 SKILLS COVERED:
Measures of Centre (Mean, Median, Mode) Measures of Spread (Range, IQR, Mean Absolute Deviation, Standard Deviation) Identifying Outliers using the 1.5 x IQR Rule Data Displays (Box Plots/Box-and-Whisker, Histograms) Simple & Compound Probability Permutations and Combinations Normal Distribution & The Empirical Rule (68-95-99.7) Introduction to Hypothesis Testing (Null/Alternative Hypotheses, P-Values, Significance Levels) 💡 HOW TO USE THIS RESOURCE:
Direct Instruction: Use the visual guided notes and workbook pages for whole-class instruction. Math Centers/Stations: Set up the 4 Probability Labs and Real-World Data Activities as collaborative stations. Independent Practice: Assign workbook pages for homework or classwork. Summative Assessment: Use the comprehensive unit test to evaluate student mastery. Sub Plans: The print-and-go format makes this the perfect emergency sub plan bundle! ✨ WHY TEACHERS LOVE THIS RESOURCE: ✅ 100% Accurate: Meticulously proofread and error-free. ✅ Premium Design: Clean, professional, and student-friendly layout. ✅ Perfect Rigor: Specifically tailored for Grades 8-10. Not too basic, not too advanced. ✅ Real-World Focus: Moves beyond rote memorization into actual data literacy and analysis. ✅ UM Printables Quality: Consistent formatting and premium design you can trust.
Frequently Asked Questions
What's included in this resource?
This resource contains 31 pages of ready-to-print materials. It is answer keys, visual supports, hands-on.
What grade level is this resource designed for?
This resource is designed for Grade 8-12. The content and activities are scaffolded to meet the developmental needs of students in this grade range.
Is this a hands-on activity?
Yes, this resource includes hands-on activities that engage students through physical manipulation and discovery-based learning. Students learn by doing, not just by completing worksheets.