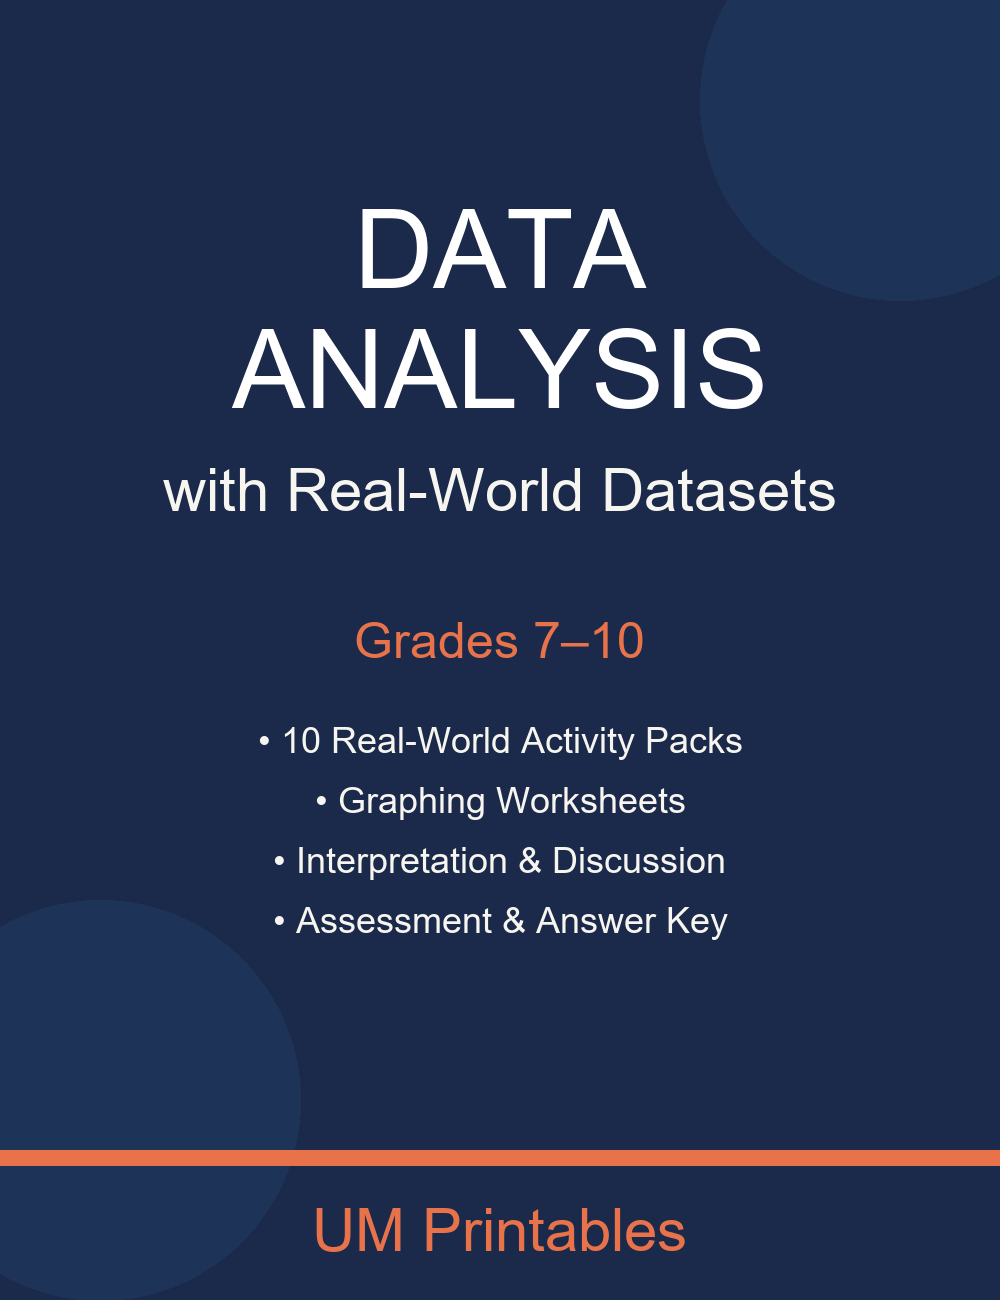
Data Analysis Real-World Datasets | Statistics Grades 6-10
Secure Razorpay checkout · Instant download · No refunds (digital product)
You'll be asked to sign in first
Quick overview
The **Real-World Statistics & Data Analysis Activities** pack is a ready-to-use resource for **Grades 6–10** that helps students move beyond simply calculating statistics to actually **analyzing, interpreting, and communicating what data means**.
Using engaging real-world datasets involving **sports, climate, social media, entertainment, sleep, population, video games, music, and nutrition**, students practice measures of center and spread, box plots, histograms, scatter plots, outliers, correlation, and data interpretation in meaningful contexts.
Ideal for **Middle School Math, Pre-Algebra, Algebra 1, Statistics, data literacy, math centers, review, and enrichment**, the resource supports statistical reasoning and mathematical modeling by connecting calculations and data displays to authentic questions and conclusions. NCTM emphasizes that statistical learning should focus on variability, context, interpretation, and using data to answer meaningful statistical questions rather than calculation alone.
Product description
Do your students struggle to see the point of statistics? Make data analysis meaningful and engaging with real-world datasets they actually care about!
This premium, print-and-go resource transitions students from simply calculating numbers to truly understanding and interpreting data. Instead of random, meaningless numbers, your students will analyze the stats behind social media usage, video game sales, Olympic medals, and more.
Perfect for Grades 6–10, this comprehensive pack builds true statistical literacy step-by-step, from calculating measures of center to identifying outliers and discussing correlation vs. causation.
✨ WHAT’S INCLUDED IN THIS 50+ PAGE RESOURCE:
📊 10 Real-World Dataset Activity Packs Each pack includes raw data tables, guided statistical calculations, data displays, and interpretation questions:
Basketball Player Statistics (Points, Assists, Rebounds) Global Climate Data (Temperature, Precipitation, Latitude) Social Media Usage (Screen time by age group) Movie Box Office Data (Opening weekend vs. total gross) Student Sleep Habits (Sleep vs. screen time) Country Population & GDP (Heavily skewed distributions) Video Game Sales (Regional vs. global sales) Olympic Medal Counts (Absolute vs. relative data) Music Streaming Data (Artist popularity & genres) School Lunch Nutrition (Calories & sugar comparison) 📈 Graphing Worksheets (Blank Templates)
Histogram & Box Plot template with frequency tables Scatter Plot & Line of Best Fit template Bar Chart & Pie Chart template with degree/percentage calculations 🗣️ 5 Class Discussion Guides Foster rich mathematical discourse with structured prompts covering:
Choosing the Right Measure of Centre The Impact of Outliers Correlation vs. Causation Absolute vs. Relative Data Making Data-Driven Decisions 📝 Comprehensive Assessment
A 50-point final assessment covering all concepts Includes multiple choice, calculations, box plot construction, and written interpretation Complete Teacher Answer Key included! 🧑🏫 Teacher Guide & Overview
Differentiation strategies for Grades 6-7 vs. 9-10 CCSS-M alignment guide 🎯 CONCEPTS COVERED:
Measures of Centre: Mean, Median, Mode (and when to use each) Measures of Spread: Range, Interquartile Range (IQR), Standard Deviation The Five-Number Summary & Box Plots Histograms vs. Bar Charts Scatter Plots & Informal Trend Identification (Positive/Negative Association) Identifying Outliers using the 1.5 × IQR Rule Choosing Appropriate Data Displays Drawing Conclusions & Recognizing Misleading Data 💡 WHY TEACHERS LOVE THIS RESOURCE:
No Prep Needed: Just print and teach! All answer keys provided. Relevant & Engaging: Teen-approved topics like TikTok, video games, and sports make math relatable. Builds Real Literacy: Moves beyond rote calculation to answer the age-old question: "When will I ever use this?" Differentiated: Accessible language for middle school, with extension prompts to challenge high schoolers. 🏷️ HOW TO USE THIS RESOURCE:
As a full Statistics Unit for Grades 6-10 As a data analysis supplement for Algebra 1 or Integrated Math As math center activities or station rotations As substitute teacher emergency sub plans
Frequently Asked Questions
What's included in this resource?
This resource contains 48 pages of ready-to-print materials. It is no-prep, answer keys, differentiated.
Is this a no-prep resource?
Yes, this resource is completely no-prep. Simply print the pages and they're ready to use in your classroom immediately. Answer keys are included for easy grading.
Who is this resource perfect for?
This resource is perfect for: Grades 6–10, this comprehensive pack builds true statistical literacy step-by-step, from calculating measures of center to identifying outliers and discussing correlation vs. causation..